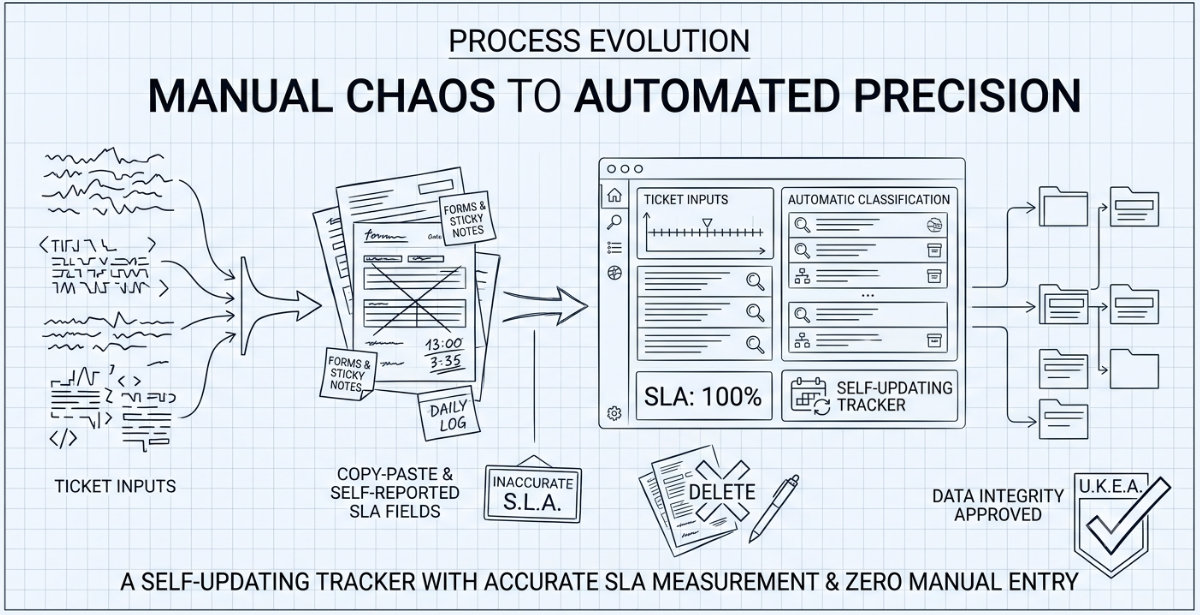
Turning a Manual Ticket Log into a Live SLA Tracker
A ticket intake process running on manual copy-paste and self-reported SLA fields turned into a self-updating tracker with automatic classification, accurate response-time measurement, and zero manual data entry.
Before
The team’s ticket tracking process ran across two disconnected sources with no automation between them:
- Two separate exports (a general request tracker and an account-creation form log) that had to be manually merged for any reporting
- “Responded within 4 hours” was a self-reported field, filled in by hand, with no verification against actual reply timestamps
- SLA measured in raw calendar time — a ticket submitted Friday evening looked identical to one that sat unanswered all weekend
- Request IDs weren’t actually unique; the field was quietly reusing the submitter’s ID across every ticket they’d ever filed
- Ticket type and account classification depended on someone reading free-text requests and typing the category in by hand
- Assignee tracking was 100% manual, with no reliable link back to who actually claimed a given ticket
After
Rebuilt into a live tracker: every request classifies, logs, and times itself the moment it comes in — no manual entry left in the loop.
| Before | After |
|---|---|
| Manual merge of two exports | Single live-updating tracker |
| Self-reported SLA field | Verified SLA, measured against real reply timestamps |
| Non-unique Request IDs | Auto-generated, collision-safe sequential IDs |
| Manual type/category tagging | Auto-detected from the request’s own structure |
| Manual assignee logging | Captured automatically the moment ownership changes |
| Static monthly reporting | Live monthly summary, feeding a team-wide metrics dashboard |
Every ticket now flows through with:
- A unique Request ID, generated the instant it’s submitted
- Type and account-category classification, detected directly from the request itself
- A first-response timestamp captured the moment a real reply lands
- SLA elapsed time calculated only across actual business hours (9:30am–6pm, Monday–Friday) — no more weekends or after-hours gaps counted against response time
- A visible flag on anything the automatic classification couldn’t confidently resolve, with a one-click way to correct it
- Assignee, filled in automatically the moment ownership changes on the underlying ticket list
A short reference guide sits at the top of the tracker covering what’s automatic, what still needs a human, and what each color flag means — so the system stays legible to anyone else on the team, not just whoever built it.
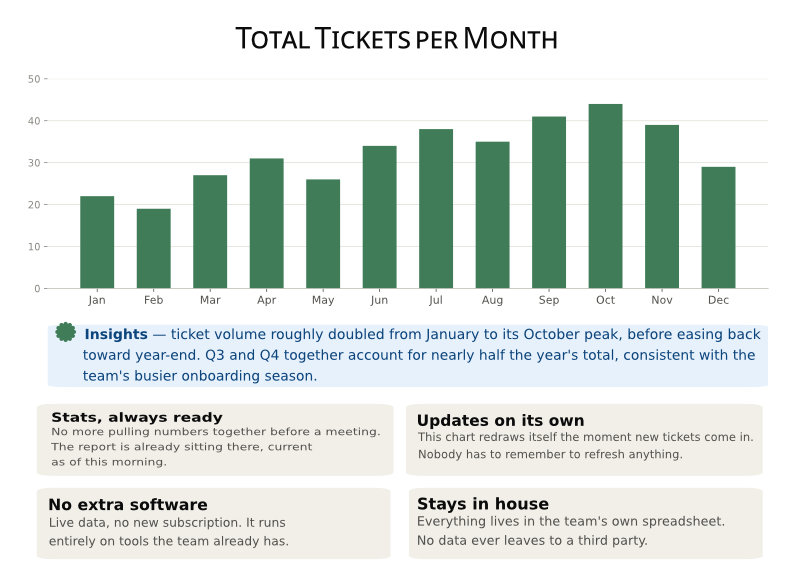 Sample data shown for illustration — the live tracker reports on real ticket volume and SLA performance.